


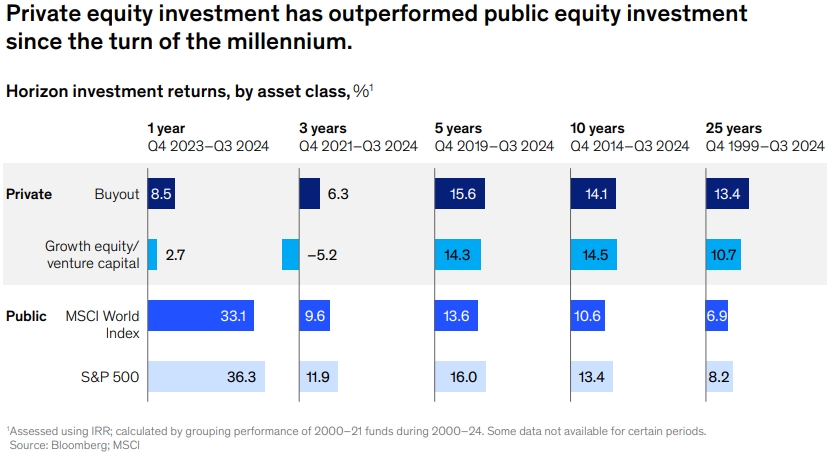
The private markets landscape in 2025 is marked by resilience, innovation, and adaptation. McKinsey’s Global Private Markets Report 2025, titled “Braced for Shifting Weather,” provides a comprehensive analysis of how private equity, real estate, private debt, and infrastructure are navigating macroeconomic uncertainties, geopolitical risks, and technological advancements.
Key Takeaways from McKinsey’s Private Markets Report 2025
1. Private Equity: Emerging from the Fog
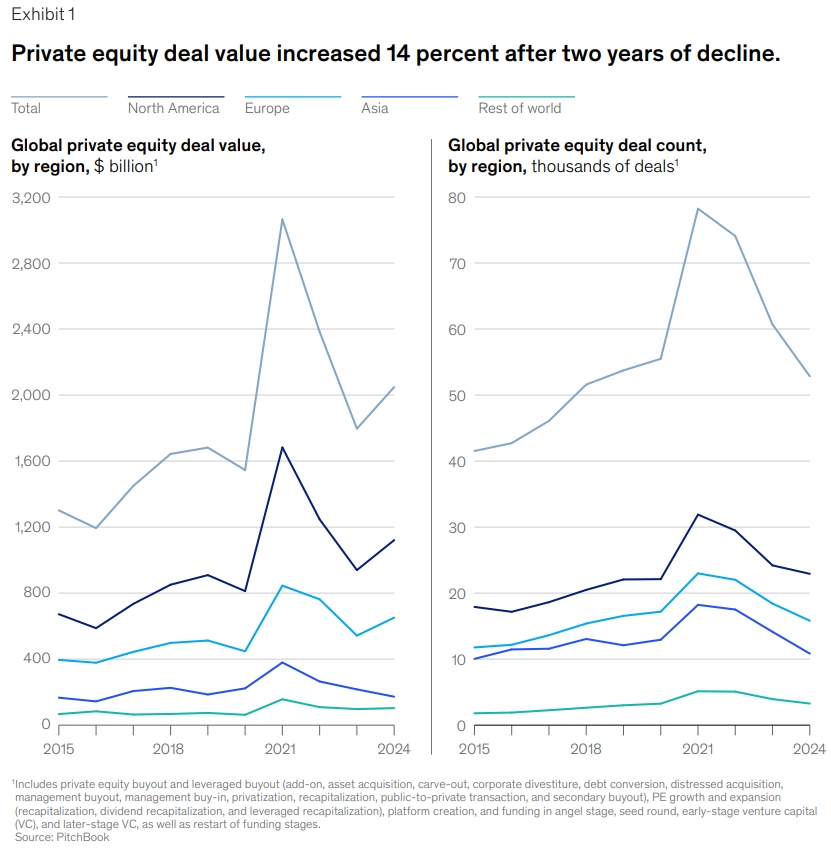
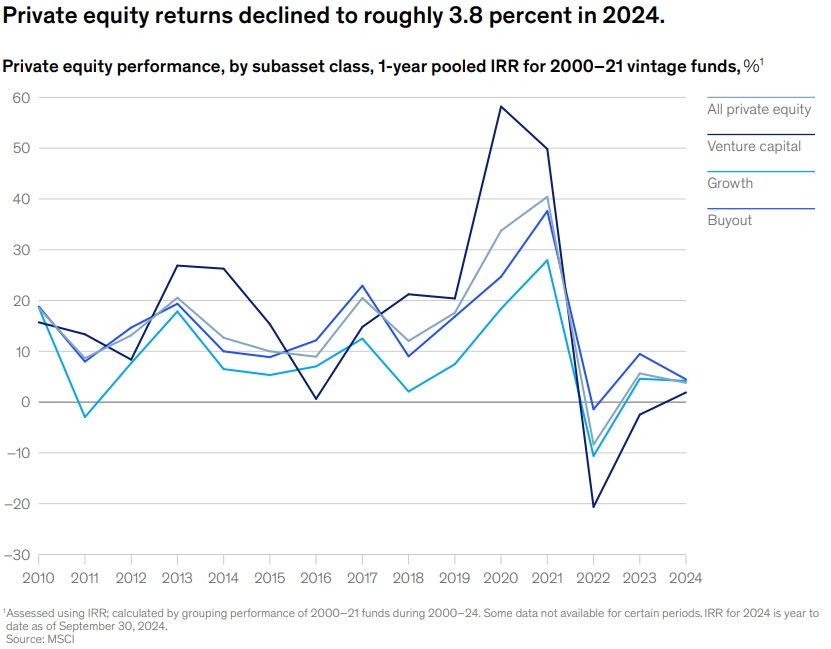
Private equity (PE) showed signs of recovery in 2024 after two years of sluggish dealmaking. Key highlights include:
1.1. Deal Activity Rebounds, But Unevenly
- Overall Growth: PE deal value rose 14% YoY to $2 trillion in 2024, marking the third-highest year on record.
- Large Buyouts Drive Recovery: Deals >$500M surged 37% in value and 3% in count, led by North America and Europe.
- Asia Lags: Fundraising fell 32%, with China’s slowdown dragging down regional performance.
- Venture Capital Struggles: Deal count dropped 16.9%, reflecting a tougher environment for startups.
Why It Matters: The rebound signals renewed confidence, but selectivity is key—top-tier funds dominate, while others face pressure.
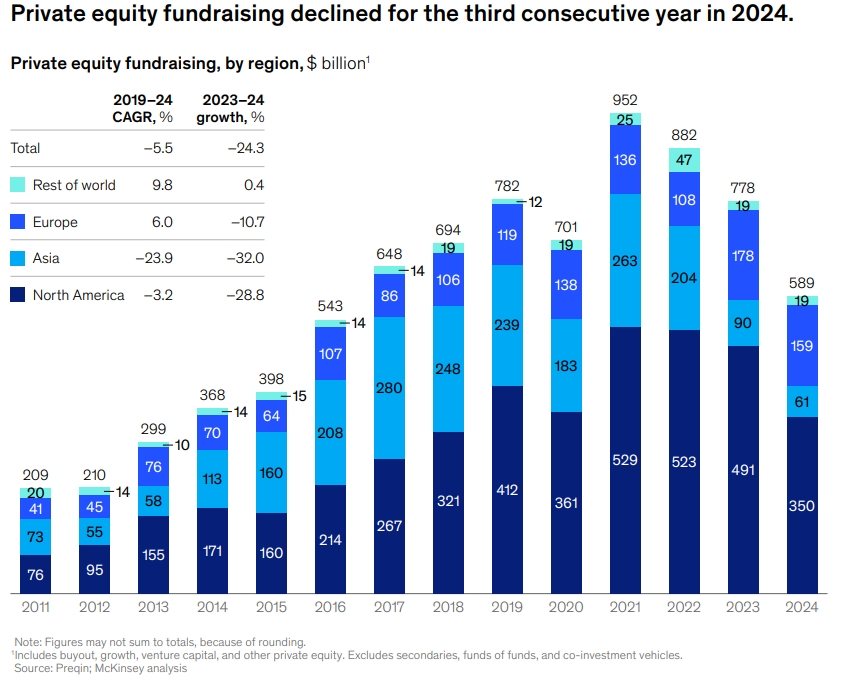
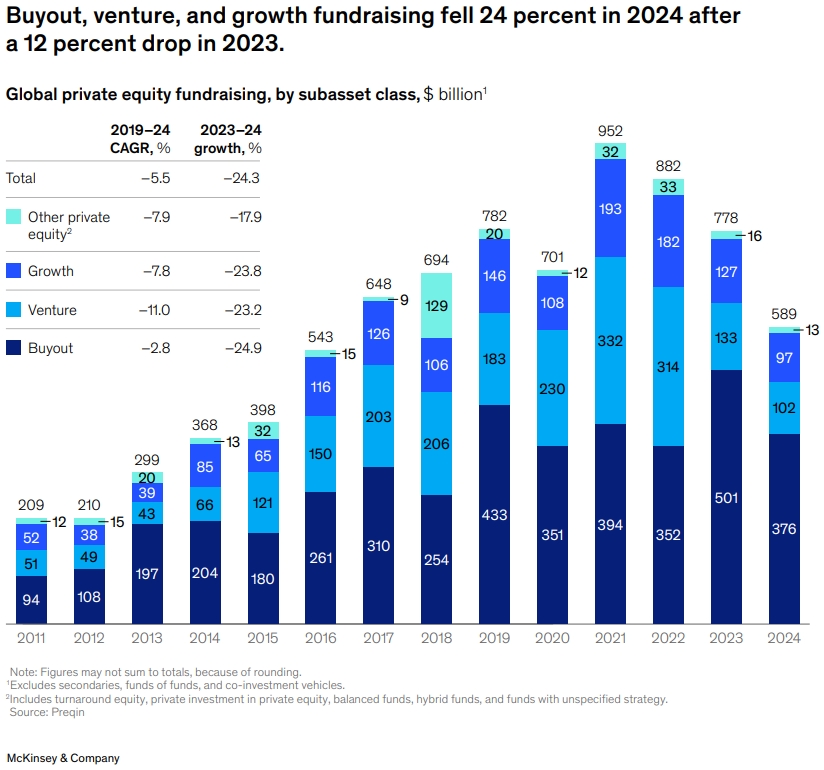
1.2. Fundraising Challenges Persist
- Third Straight Decline: Traditional fundraising fell 24% to $589B, the lowest since 2016.
- Midmarket Shines: Funds sized $1B–$5B bucked the trend, staying flat YoY, while mega-funds (>$10B) dropped sharply.
- Longer Fundraising Cycles: GPs spent 21.9 months on average to close funds (vs. 14.1 months in 2018).
Key Takeaway: LPs are becoming more selective, favoring established managers and niche strategies.
1.3. The Exit Backlog Hits a Record High
- 18,000+ Companies Await Exit—61% of buyout-backed assets have been held >4 years (vs. 53% 10-year avg).
- Sponsor-to-Sponsor Deals Rise: Made up 45% of exits in 2024 (10-year high), as IPOs remain sluggish.
- Valuation Mismatch: Marks on aging assets are 17% above market prices, complicating sales.
Implications: GPs must prioritize operational value creation and explore alternative exits (secondaries, continuation vehicles).
1.4. Value Creation Shifts to Operations
- Financial Engineering Fades: With high entry multiples (median 11.9x EBITDA), leverage-driven returns are harder to achieve.
- New Focus: Top-quartile funds now derive ~39% of returns from revenue growth and margin expansion (vs. 61% from multiples/leverage).
- Add-On M&A Accelerates: 40% of 2024 deal value came from bolt-ons (vs. 27% in 2010).
Action Item: Portfolio companies must optimize cash flow, digitize operations, and prep earlier for exits.
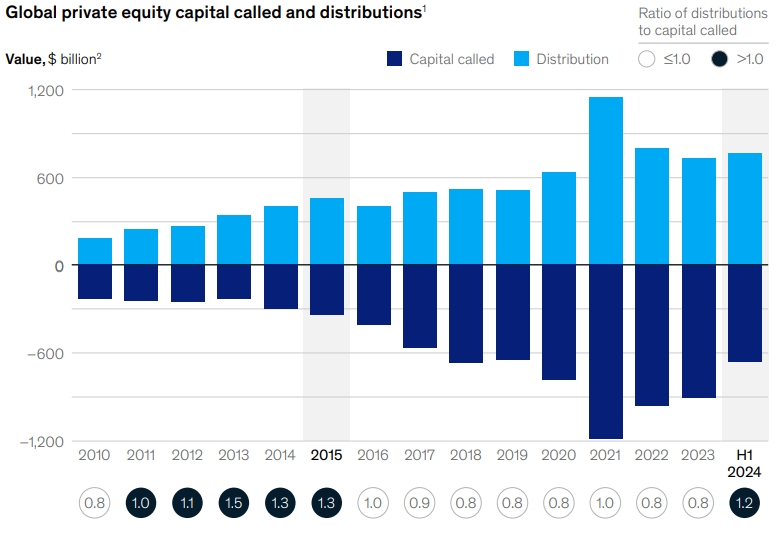
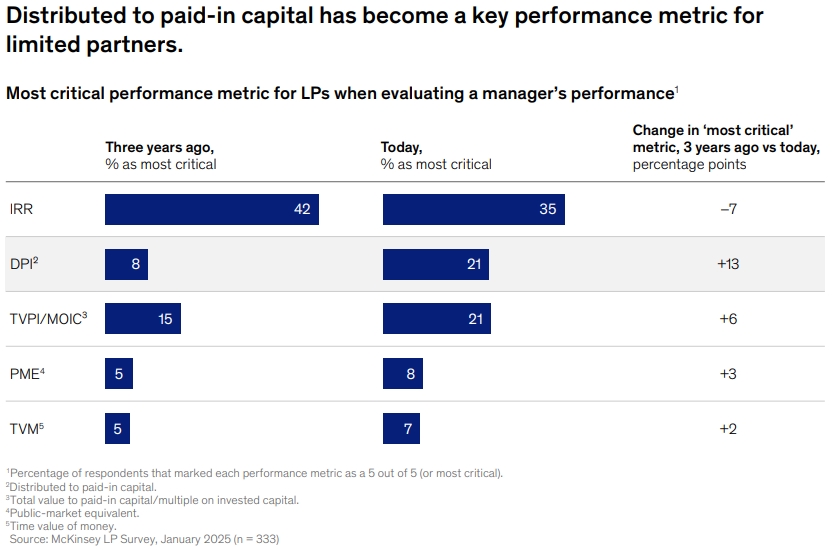
1.5. LP Priorities Are Changing
- Cash Flow Matters: Distributions exceeded capital calls in 2024—first time since 2015.
- Performance Metrics Shift:
Investor Insight: LPs reward GPs who deliver consistent liquidity, not just paper gains.
1.6. The Road Ahead: Risks & Opportunities
Challenges:
- Refinancing 2021–22 vintage deals amid higher rates.
- Geopolitical uncertainty (e.g., tariffs, AI disruption).
Opportunities:
- GP-led secondaries ($75B in 2024) for liquidity.
- High-net-worth capital via evergreen funds.
- AI-driven value creation (e.g., pricing optimization, predictive maintenance).
2. Real Estate: Reaching for Daylight
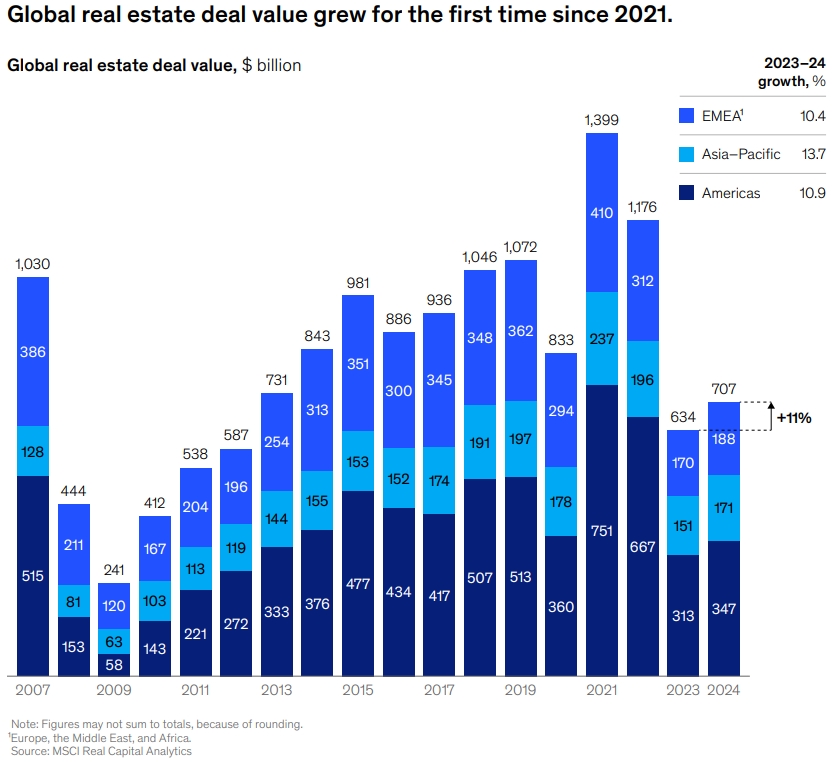
The real estate sector saw a partial recovery in 2024, with deal value growing 11% to $707 billion, but challenges remain:
2.1. Market Recovery Takes Hold (But Unevenly)
- Transaction Volume Rebounds (+11% to $707B globally)
- First growth since 2021 after consecutive annual declines
- Asia-Pacific leads recovery (+14%) followed by Americas (+11%) and EMEA (+10%)
- Sector Divergence Intensifies
- Winners: Data centers (+11.2% returns), manufactured housing (+11.7%), senior housing (+5.6%)
- Strugglers: Office sector occupancy falls to 86% (vs. 90% 10-year average)
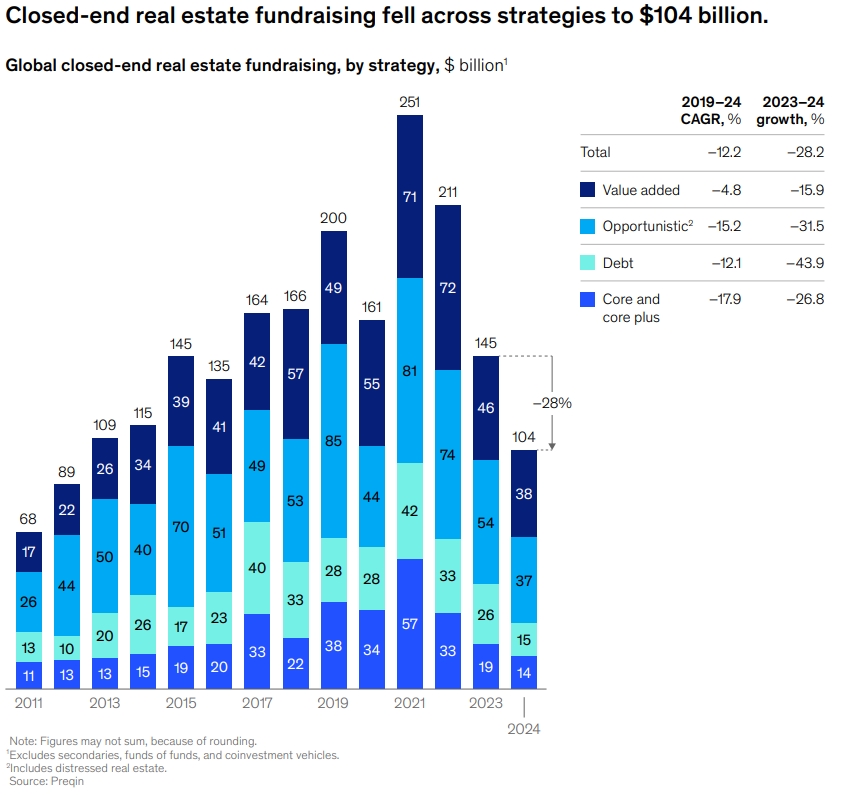
2.2. Capital Markets: The Great Reset
- Fundraising Hits Decade Low
- Closed-end fundraising down 28% to $104B (lowest since 2012)
- Opportunistic strategies hit hardest (-31.5%)
- Open-End Fund Pressures Continue
- NFI-OE funds post second-ever negative return (-1.6%)
- Net outflows remain elevated at -$12B (slightly better than 2023’s -$12.6B)
2.3. The New Value Creation Playbook
Operational Capabilities Become Key Differentiator
- Operators now control 37% of AUM (up 11pp over decade)
- Leaders combine:
- Hands-on asset management
- Data-driven decision making
- Tenant experience optimization
Tech-Enabled Operating Models
- AI applications in:
- Maintenance routing
- Capital allocation
- Lease management
- Digital twins for remote operations
2.4. Data Centers: The New Crown Jewel
- Unprecedented Demand Growth
- Hyperscalers lease record 4,000MW in 2024
- 75% of construction pipeline pre-leased
- Development Challenges
- Power access becomes critical constraint
- New hotspots emerge (Indiana, Brazil)
- Investment Strategies
- Build-to-suit dominates
- Energy partnerships (e.g., nuclear-powered campuses)
2.5. The Looming Refinancing Wall
$2.1T of U.S. CRE Loans Maturing (2025-2027)
- Office and multifamily most exposed
- Banks retreat – private credit steps in
Distressed Opportunities Emerge
- Debt funds active in:
- Mezzanine financing
- Preferred equity
- Loan-to-own strategies
2.6. LP Portfolio Repositioning
Alternative Sectors Gain Allocation
- 46% of LPs plan to increase alternatives exposure
- Focus on:
- Digital infrastructure
- Healthcare-related
- Last-mile logistics
Thematic Investing Rises
- Energy transition
- Demographic shifts
- Supply chain rewiring
2.7. Path Forward: Weathering the Transition
Critical Success Factors:
- Sector Selection Discipline – Avoid fading asset classes
- Operational Intensity – Move beyond passive ownership
- Capital Partner Creativity – Explore insurance capital, joint ventures
- Tech Adoption – Implement AI/analytics at scale
Emerging Risks:
- Prolonged valuation uncertainty
- Labor shortages in construction
- Geopolitical impacts on supply chains
The sector’s winners will be those who combine sector specialization, operational expertise, and flexible capital structures to navigate this complex environment.
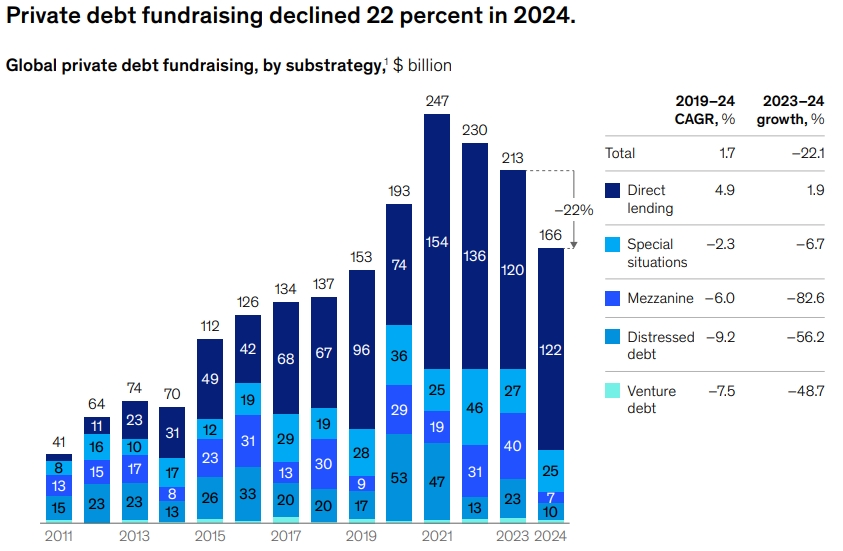
3. Private Debt: Steady in the Crosswinds
Private debt remained resilient, with $166 billion raised in 2024 (-22% YoY). Key trends:
3.1. Market Performance: The Steady Anchor
- Fundraising Contraction with Silver Linings
- Overall decline of 22% to $166B (5th largest year historically)
- Direct lending proves most resilient (+2% to $122B)
- Mezzanine debt suffers most (-83% drop, reflecting risk aversion)
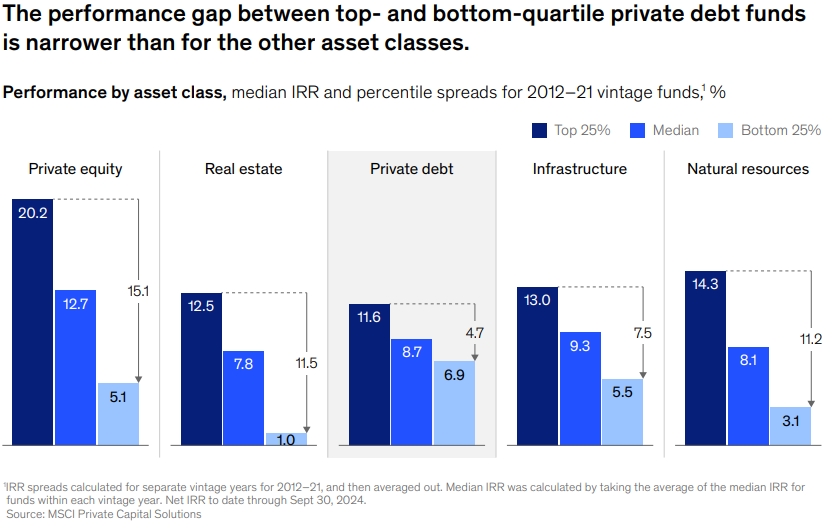
- Performance Metrics Show Strength
- Median net IRR of 6.6% (outperforming PE and real estate)
- Lowest return dispersion among alternatives (4.7% top-bottom quartile spread)
- Default rate remains contained at 2.7% (vs. 4.7% for broadly syndicated loans)
3.2. The Direct Lending Dominance
- Market Share Dynamics
- Structural Advantages
- Speed and certainty of execution
- Covenant protections
- Relationship-based underwriting
3.3. The Capital Stack Revolution
- Insurance Capital Emerges as Power Player
- $1.5-2T allocated to private debt strategies
- Preferred for:
- Long-duration assets
- Floating rate exposure
- Senior secured positions
- Retail Channels Expand
- BDC issuance triples YoY
- Interval funds gain traction among HNW investors
- SEC regulatory changes facilitate access
3.4. Sectoral Shifts & Opportunity Zones
- Traditional Middle Market Lending
- EBITDA thresholds expand to $25-75M range
- Unitranche structures dominate (>60% of deals)
- EBITDA adjustments scrutinized more closely
- New Frontier Opportunities
- Asset-Based Finance: Aircraft, railcars, royalties
- Infrastructure Debt: Renewable energy projects
- Commercial Real Estate: Bridge financing for maturing loans
3.5. The Bank Retreat & Regulatory Catalysts
- Basel IV Accelerates Disintermediation
- Higher risk weights for corporate loans
- Liquidity coverage ratio pressures
- Internal model restrictions
- New Partnership Models Emerge
- Bank-GP origination partnerships
- “Originate-to-distribute” platforms
- Specialty finance joint ventures
3.6. Credit Underwriting in the New Era
- Enhanced Focus on:
- Recurring revenue quality
- Management equity alignment
- ESG-linked covenants
- AI-driven early warning systems
- Documentation Trends:
- Springing maturity extensions
- EBITDA calculation guards
- Sponsor equity cure provisions
3.7. The Road Ahead: Challenges & Opportunities
Emerging Risks:
- Refinancing wave (>$620B HY/leveraged loans maturing 2026-27)
- Margin compression from competitive pressures
- Potential economic slowdown impacts
Strategic Imperatives for Managers:
- Differentiate Through Sector Expertise (tech, healthcare, business services)
- Build Insurance & Retail Distribution
- Develop Specialized Workout Capabilities
- Leverage Technology for Portfolio Monitoring
Private debt stands at an inflection point – no longer just a bank substitute, but a sophisticated asset class developing its own ecosystem. The most successful managers will be those who can balance disciplined risk management with innovative structuring across the evolving opportunity set.
4. Infrastructure: Poised for Clearer Conditions
McKinsey’s Global Private Markets Report 2025 highlights infrastructure as a sector on the cusp of recovery, driven by powerful structural trends despite near-term fundraising headwinds. Here’s a distilled yet comprehensive analysis:
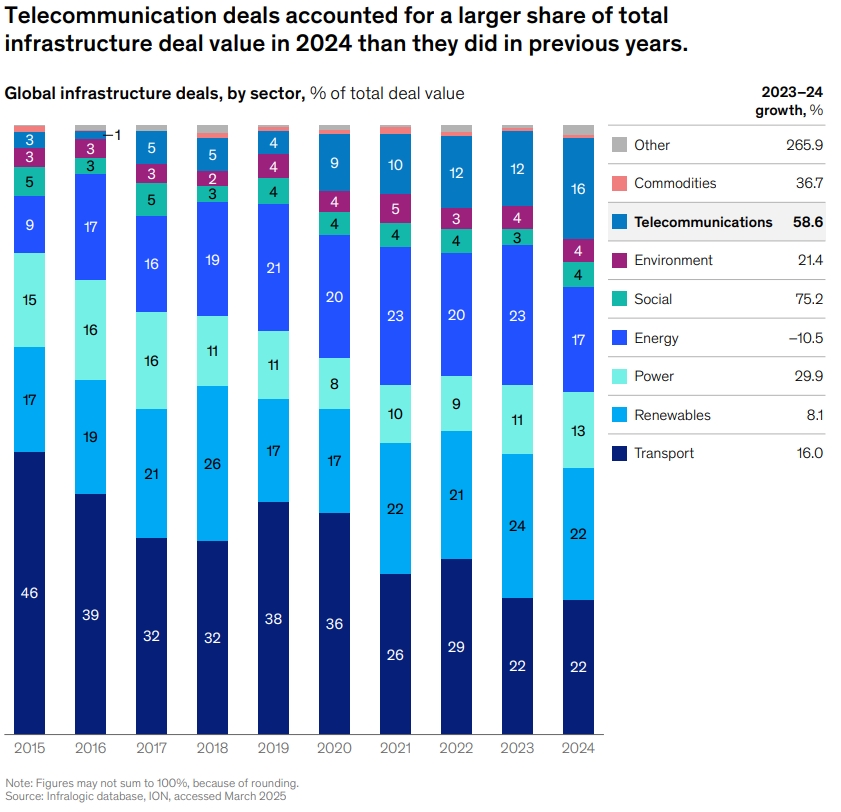
4.1. Deal Activity: Green Shoots Emerge
- Rebounding Transactions:
- 18% YoY growth in global deal value (second-highest year on record)
- 7% increase in deal count, indicating larger average deal sizes
- Sector Leaders:
- Telecom (16% of deals), fueled by data centers (+58% of telecom transactions)
- Renewables (22% share), maintaining above-decade average
- Transport (22% share) remains dominant but declines from 46% in 2015
Key Insight: Hybrid assets (e.g., energy-powered data centers) redefine sector boundaries.
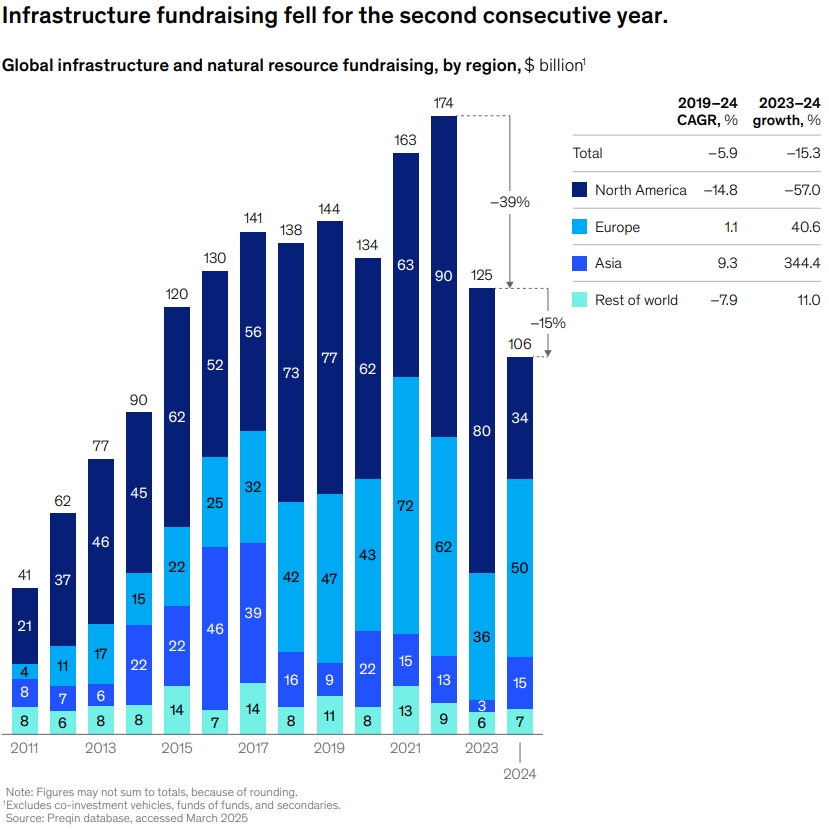
4.2. Fundraising Challenges Mask Long-Term Demand
- Contraction Continues:
- 15% decline to $106B (lowest in a decade)
- 26-month average fundraising cycles (+9 months vs. 2019)
- Bright Spots:
- Value-added strategies surge to 34% of fundraising (vs. 19% 10-year avg)
- 46% of LPs plan allocation increases – highest among private assets
Contradiction: Short-term capital raising struggles contrast with robust LP conviction.
4.3. The Energy-Digital Nexus Reshapes Investing
Data Center Boom:
- Demand hits 66GW in 2024, projected 219GW by 2030 (+22% CAGR)
- Innovative power solutions:
- On-site nuclear (e.g., Cumulus Data’s 960MW campus)
- Renewable integration + gas peakers
- Grid Modernization:
- Transmission/distribution upgrades become priority investments
Strategic Shift: Infrastructure GPs now compete with tech investors for digital-physical assets.
4.4. Value Creation Takes Center Stage
- From Passive to Active:
- Project Execution: Avoiding delays through prefab construction/digital twins
- Labor Innovation: Remote operations, upskilling, automation
- Service Sector Expansion:
- “Infrastructure-adjacent” services (e.g., data center maintenance) gain traction
Performance Edge: Top-quartile funds derive 50+% of returns from operational improvements.
4.5. LP Appetite Defies Allocation Overhang
- Pension Funds Lead: Drawn to predictable cash flows
- Family Offices Most Bullish: Willing to accept illiquidity for higher yields
- Thematic Preferences:
- Decarbonization (renewables, grid storage)
- Digitalization (towers, fiber)
- Supply chain resilience (ports, cold storage)
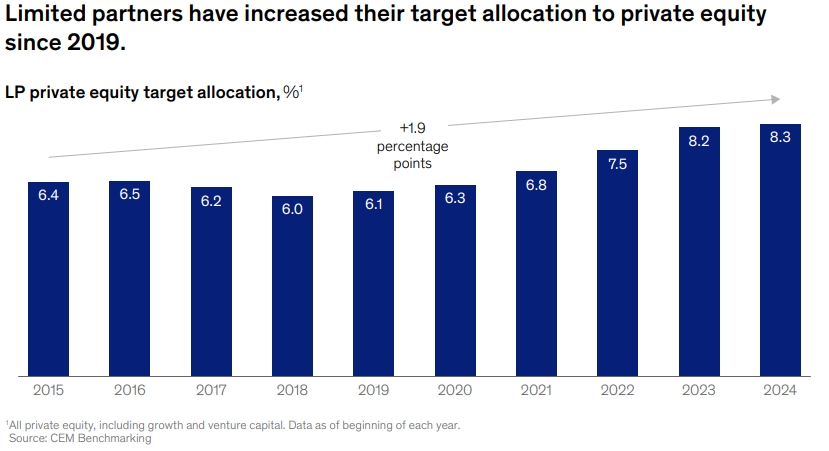
Allocation Paradox: Despite being 50bps overallocated, LPs still seek exposure.
4.6. Risks & Differentiators
| Challenges | Winning Strategies |
|---|---|
| Construction cost inflation | Fixed-price contracts |
| Permitting delays | Government partnerships |
| Talent shortages | Modular building techniques |
| Rate volatility | Hedging programs |
4.7.Conclusion: The Infrastructure Evolution
The sector is transitioning from traditional “bricks and mortar” to complex, tech-integrated platforms. Success will require:
- Cross-sector expertise (energy + digital)
- Operational hands-on approach
- Creative capital solutions (BLENDED FINANCE, tax equity)
Final Thought: Infrastructure is no longer just about steady yields – it’s becoming a high-conviction, thematic play on global megatrends.
Industry Deep Dives
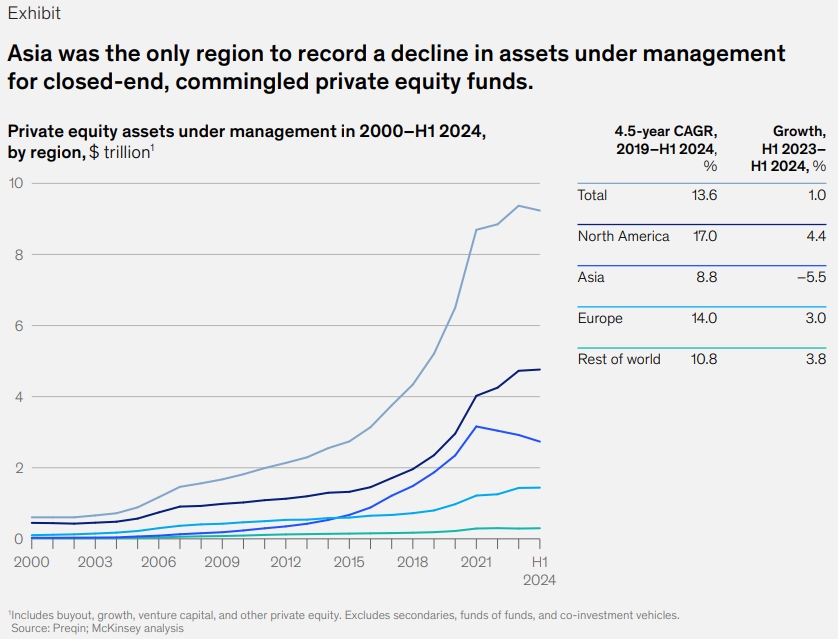
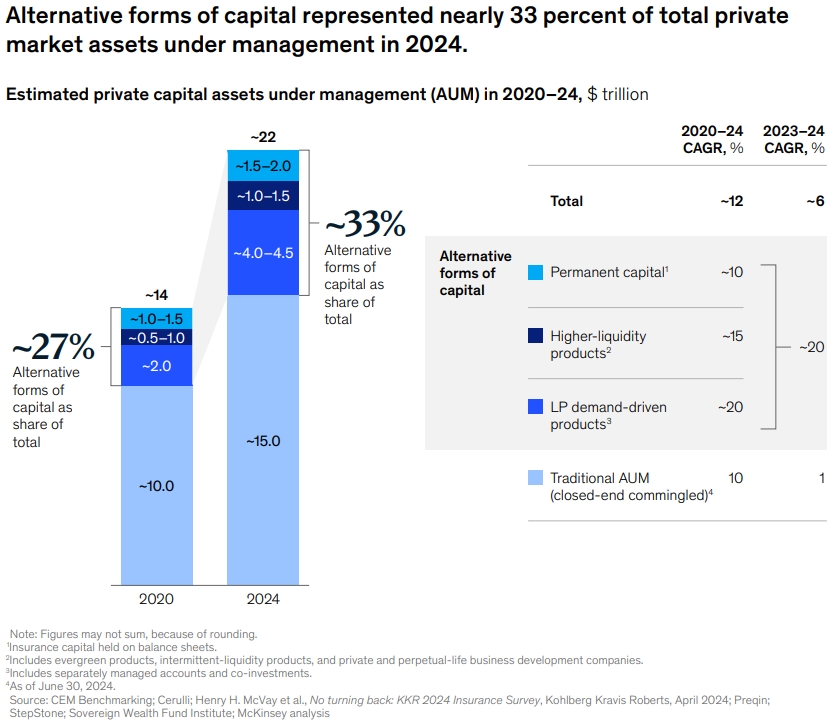
1. The Rise of Alternative AUM Forms
Private markets report 2025 reveals a seismic shift in private markets as non-traditional capital vehicles now represent ~35% of global AUM ($7-8 trillion). This transformation is redefining how institutional and retail investors access alternatives. Here’s what matters:
1.1. The New AUM Landscape
- Traditional Closed-End Funds ($14-15T):
- Growth slows to 1% in 2024 (vs. 13% CAGR since 2000)
- Alternative Vehicles ($7-8T):
- Growing at 16-18% annually (5x faster than traditional funds)
- Now represent 1/3 of total private markets AUM
1.2. Three Disruptive Capital Channels
A. Higher-Liquidity Vehicles ($1-1.5T AUM)
- Includes: Evergreen funds, private BDCs, interval funds
- Growth Driver: Democratization (401(k) access, European ELTIF reforms)
- Example: Blackstone’s $100B+ perpetual capital platform
B. LP-Customized Solutions ($4-4.5T AUM)
- Separate Accounts: $1.5-2T (+18% YoY)
- Co-Investments: $2.5T (+25% YoY)
- Appeal: Fee savings + control over sector/thematic exposure
C. Permanent Capital ($1.5-2T AUM)
- Insurance balance sheets (e.g., KKR’s Global Atlantic)
- Sovereign wealth fund direct investments
- Key Advantage: Eliminates fundraising cycles
1.3. The Retail Gold Rush
- $60T Addressable Market (vs. $12T institutional)
- Breakthrough Models:
- Fund aggregators (iCapital, CAIS)
- Semi-liquid interval funds
- Private wealth feeder vehicles
- Regulatory Catalysts:
- U.S. 401(k) rule changes (2022)
- EU ELTIF 2.0 (2024)
1.4. Why This Matters Now
- Performance: Alternative AUM vehicles outperformed traditional funds by 300bps+ (2019-24)
- Alignment: SMAs/co-investments improve GP-LP incentives
- Stability: Permanent capital reduces distribution pressure
1.5. Manager Imperatives
- Build dedicated retail distribution teams
- Develop “capital solutions” expertise (vs. just fundraising)
- Tech Enablement: Digital platforms for smaller LPs
The Bottom Line: The lines between private/public markets are blurring. Winners will master three-dimensional capital raising—simultaneously serving institutions, insurers, and retail investors through tailored vehicles.
“The future belongs to firms that can raise $1B from a pension fund, $100M from a private bank network, and $50M from an insurance JV—all for the same strategy.”
2. Solving PE’s Historic Exit Backlog
McKinsey’s global private markets report reveals private equity faces its most severe exit bottleneck in 20 years, with 18,000+ companies (61% of buyout portfolios) held beyond the traditional 4-year horizon. Here’s how top firms are navigating the challenge:
2.1. The Exit Crisis by the Numbers
- Record Hold Times: Average 6.7 years vs. 5.7-year historical norm
- Valuation Mismatch: Marks 17% above market prices (vs. 3-4% pre-2022)
- Sector Pain Points:
- Consumer discretionary: 29% overvalued
- Technology: 26% overvalued
- Healthcare: Most balanced (4% premium)
2.2. Why Exits Are Frozen
- Bid-Ask Spread: Sellers cling to 2021 valuations (median 12x entry multiples)
- IPO Market Slump: PE-backed IPOs down 20% by count in 2024
- Debt Market Constraints: Refinancing 2021-22 deals at higher rates
- Quality Bar Rising: Only “perfect” assets transact
2.3. The GP Playbook for Liquidity
A. Pre-Investment Preparation
- Diligence Add-On: Map potential buyers during due diligence
- “Reverse Roadshow“: Identify 3-5 logical next owners pre-close
B. Holding Period Optimization
- Mid-Cycle Value Creation Plans: Launch at Year 3 to refresh growth
- Carve-Out Readiness: Prep non-core units for separate sales
- Add-On M&A: 40% of 2024 deal value came from bolt-ons
C. Exit Pathway Strategies
| Sponsor-to-Sponsor | Strategic Buyer | IPO | |
|---|---|---|---|
| Key Focus | Uncapped upside story | Synergy potential | Growth consistency |
| Prep Work | Build GP relationships | Align business units | Public co. capabilities |
| 2024 Share | 45% of exits | 50% | 5% |
2.4. Innovative Solutions Gaining Traction
- Continuation Vehicles: $75B deployed in 2024 (+84% YoY)
- Stapled Secondaries: Package exits with new fund commitments
- Dividend Recaps: Returning capital without full exits
2.5. LP Pressure Points
- DPI Obsession: 21% now call distributions “critical” (+13pp since 2021)
- Performance Metric Shift:
- IRR importance drops 7pp
- MOIC gains 6pp (better suits long holds)
2.6. The Road Ahead
Immediate Actions:
- Re-underwrite all assets >4 years held
- Prioritize “good enough” exits over perfect timing
- Develop internal secondary market expertise
Structural Shifts:
- Hold periods extending to 7-10 years
- More GP-led tender offers
- Rise of sector-focused continuation funds
Key Insight: The backlog won’t clear through market timing alone. GPs need operational solutions to bridge valuation gaps and creative structuring to meet LP liquidity demands.
“The best exit strategy starts at entry.”
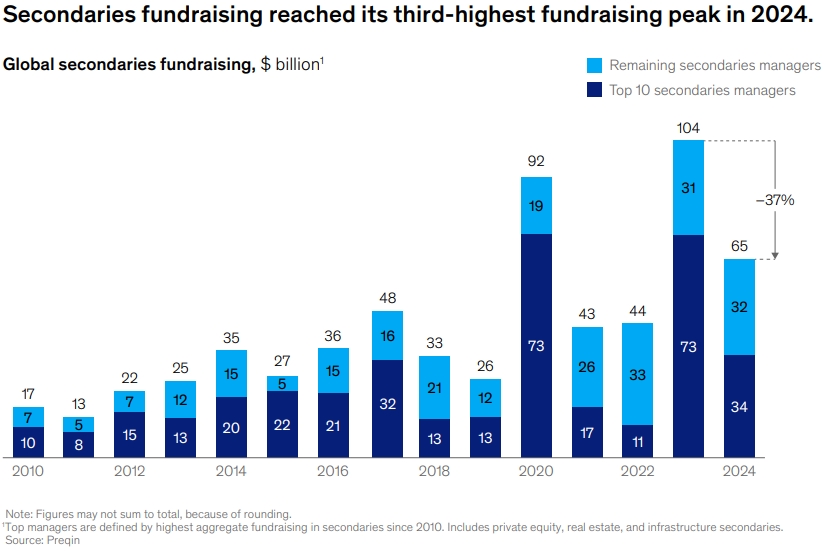
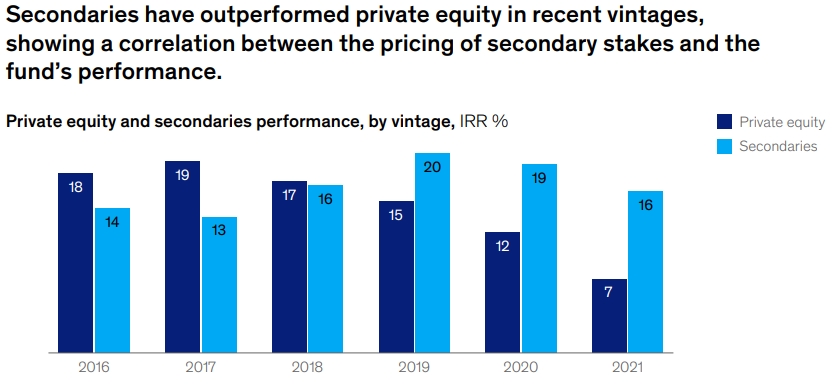
3. Secondaries & GP Stakes: The Next Wave
Private markets report highlights how these once-niche strategies are transforming private markets, offering solutions to today’s toughest challenges – from exit backlogs to generational transitions.
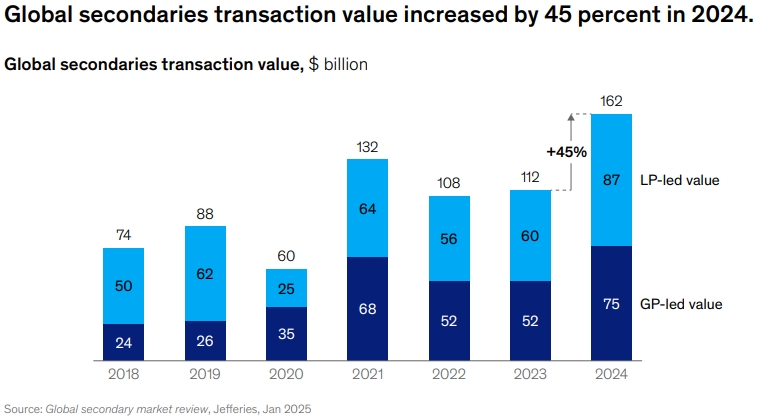
3.1. The Secondary Market Boom
By the Numbers:
- $162B in 2024 transactions (+45% YoY)
- LP-led deals: $87B (54% of total)
- GP-led deals: $75B (84% continuation vehicles)
Why It’s Hot:
- Pricing Recovery: 89% of NAV (vs. 85% in 2023)
- Performance: 14.6% median IRR (outpacing PE since 2016)
- Liquidity Lifeline: Turns “trapped capital” into cash for LPs
Top Buyers Want:
- Discounts to NAV (but less than before)
- GP track records
- Clear residual value creation potential
3.2. GP Stakes: Investing in the “Invisible Asset”
Market Snapshot:
- $4.4B raised in 2024 (after $600M dip in 2023)
- 11 funds closed (record number)
- 43% of LPs now invest in stakes funds
The Appeal:
- Resilient Returns: 16.8% median IRR (2012-21 vintages)
- Low Volatility: Just 7.9% top-bottom quartile spread
- Strategic Value: Helps GPs with succession, tech investment
Who’s Buying:
- 70% of sovereign wealth funds exploring direct stakes
- Mega-funds like Blue Owl and Dyal dominate
3.3. How These Strategies Solve Core Problems
| Market Pain Point | Secondaries Solution | GP Stakes Solution |
|---|---|---|
| Exit backlog | Continuation vehicles extend holds | Provides growth capital to retain top talent |
| LP overallocation | Liquidity for stale positions | Alternative to committing to new funds |
| Fee pressure | Restructures economics | Aligns GP/LP interests permanently |
| Succession risks | N/A | Funds next-gen leadership transitions |
3.4. The Future Playbook
For LPs:
- Use secondaries to rebalance portfolios
- Consider GP stakes for “private markets beta” exposure
For GPs:
- Build internal secondaries expertise
- Explore stake sales for strategic partnerships
Prediction: By 2027, these strategies could represent 15-20% of total private markets activity, up from ~10% today.
Conclusion: What’s Next for Private Markets?
2025 will be a year of selective growth, operational discipline, and innovative fundraising. Key actions for investors:
✅ Diversify into alternative AUM (evergreen funds, SMAs).
✅ Prioritize value creation over financial engineering.
✅ Leverage secondaries for liquidity in a slow-exit environment.
Links For More
For more insights, download the full report from McKinsey website or NeoForm LinkedIn page.
Need help on investment in private markets? Contact NeoForm’s partners for more tailored consulting and solutions.
🔗 Related Reads:
- Global Private Markets Report 2025: Private Equity Emerging from the Fog
- Private Equity Market Trends in 2025: A Year of Recovery and Strategic Shifts
- The Future of Investing: Private Markets and Credit in 2025
- Credit Market Outlook 2025: Rising Private Credit and Asia-Pacific
15 Comments
Healthcare Private Equity Trends in 2025 from Bain Report - NeoForm Business Partners
[…] McKinsey Global Private Markets Report 2025 […]
Midyear Private Equity Report 2025 by Bain - NeoForm Business Partners
[…] McKinsey Global Private Markets Report 2025 […]
Value Transformation in Private Equity - NeoForm Business Partners
[…] McKinsey Global Private Markets Report 2025 […]
EY Global IPO Trends Q2 2025: Navigating Volatility, Seizing Opportunity | NeoForm - NeoForm Business Partners
[…] McKinsey Global Private Markets Report 2025 […]
Mid-year M&A Report 2025 by Bain: How to Find Opportunity in Chaos | NeoForm - NeoForm Business Partners
[…] McKinsey Global Private Markets Report 2025 […]
How Private Equity Funds Can Use M&A to Create Outsize Returns - NeoForm Business Partners
[…] McKinsey Global Private Markets Report 2025 […]
Asset-Based Finance: The $6+ Trillion Private Credit Opportunity You Can't Ignore - NeoForm Business Partners
[…] McKinsey Global Private Markets Report 2025 […]
McKinsey Technology Trends 2025: What Is Crucial to Align Your Business - NeoForm Business Partners
[…] McKinsey Global Private Markets Report 2025 […]
Credit Market Review 2025: Partnership Capital is Fueling M&A - NeoForm Business Partners
[…] McKinsey Global Private Markets Report 2025 […]
How Global Economic Profit Reached an All-Time High - NeoForm Business Partners
[…] McKinsey Global Private Markets Report 2025 […]
Evergreen Private Equity Strategies - NeoForm Business Partners
[…] McKinsey Global Private Markets Report 2025 […]
Global Banking Review 2025: McKinsey Insights on Winning Strategies - NeoForm Business Partners
[…] McKinsey Global Private Markets Report 2025 […]
Family Business Report 2025: KPMG Insights for Growth - NeoForm Business Partners
[…] McKinsey Global Private Markets Report 2025 […]
How Private Markets Are Redefining Corporate & Investment Banking - BCG 2025 - NeoForm Business Partners
[…] McKinsey Global Private Markets Report 2025 […]
Global Wealth Management Report 2025: Rethinking the Playbook - NeoForm Business Partners
[…] McKinsey Global Private Markets Report 2025 […]
Comments are closed.