

The global economy is on the brink of a massive transformation, driven by technological advancements, shifting consumer behaviors, and the urgent need for sustainability. A groundbreaking report by the McKinsey Global Institute, The Next Big Arenas of Competition, identifies 18 industries as super high-growth sectors of future poised to reshape the business landscape by 2040. These “arenas” are defined by high growth and high dynamism, capturing an outsized share of economic value and market disruption.
By 2040, these high-growth sectors could generate $29 trillion to $48 trillion in revenues and account for 10–16% of global GDP, up from just 4% today. For businesses, investors, and policymakers, understanding these arenas is crucial to staying ahead in the next era of competition.
What Makes an “Arena”?
McKinsey defines arenas of competition as industries that exhibit:
- Exceptional Growth: Revenue and market cap expand far faster than the broader economy.
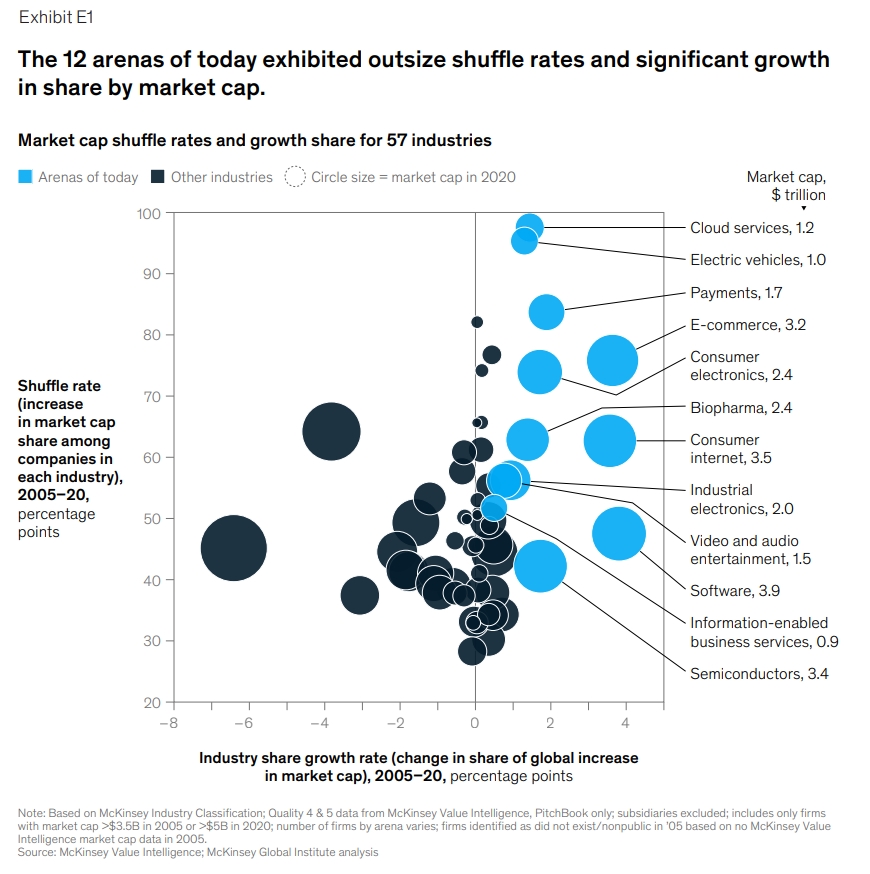
- High Dynamism: Market share shifts dramatically among competitors due to innovation and disruption as measured by the “shuffle rate,” a metric of company market share movements.
These two characteristics signal a new era of competition and signify new technologies and business models in play. Arenas earn far greater profits than other industries do, they spawn a disproportionate number of global giants, and they offer unusually strong opportunities for new entrants to become powerhouses. In NeoForm we call them super high-growth sectors of future.
From 2005 to 2020, 12 arenas—including e-commerce, cloud computing, and electric vehicles (EVs)—tripled their share of global GDP. Tomorrow’s arenas will be even more transformative, reshaping how we live, work, and consume.
The 12 Current Arenas Reshaping the Global Economy
McKinsey report identifies 12 industries that have driven unprecedented growth and disruption from 2005 to 2020. By 2020, these 12 arenas accounted for 49% of global economic profit, up from just 9% in 2005. They had a revenue compound annual growth rate (CAGR) of 10 percent and market capitalization CAGR of 16 percent, and they tripled their global GDP share from 3 to 9 percent in the period. By contrast to these super high-growth sectors, non-arenas had only a 4 percent revenue CAGR and a 6 percent market cap CAGR over the same period.
Here’s a breakdown of each:
1. Software
- Key Players: Microsoft, Oracle, Adobe
- Growth Drivers: Shift to SaaS (Software as a Service), enterprise digitization.
- Revenue (2020): $349B (11% CAGR since 2005).
- Key Players: Nvidia, TSMC, Intel
- Growth Drivers: AI chips, IoT, automotive demand.
- Revenue (2020): $574B (6% CAGR).
- Key Players: Alphabet (Google), Meta (Facebook), Tencent
- Growth Drivers: Social media, digital ads, global internet penetration.
- Revenue (2020): $395B (15% CAGR).
4. E-commerce
- Key Players: Amazon, Alibaba, JD.com
- Growth Drivers: Online retail expansion, logistics innovation.
- Revenue (2020): $874B (31% CAGR).
5. Consumer Electronics
- Key Players: Apple, Samsung, Huawei
- Growth Drivers: Smartphones, wearables, ecosystem lock-in.
- Revenue (2020): $520B (7% CAGR).
- Key Players: Amgen, Regeneron, Pfizer (biotech segment)
- Growth Drivers: Gene therapies, monoclonal antibodies.
- Revenue (2020): $343B (13% CAGR).
7. Industrial Electronics
- Key Players: Foxconn, Panasonic, Siemens
- Growth Drivers: Smart manufacturing, automation.
- Revenue (2020): $987B (6% CAGR).
8. Payments
- Key Players: Visa, Mastercard, PayPal
- Growth Drivers: Digital transactions, fintech disruption.
- Revenue (2020): $146B (10% CAGR).
9. Video & Audio Entertainment
- Key Players: Netflix, Disney, Warner Bros.
- Growth Drivers: Streaming, on-demand content.
- Revenue (2020): $424B (7% CAGR).
10. Cloud Services
- Key Players: AWS (Amazon), Microsoft Azure, Google Cloud
- Growth Drivers: Enterprise migration, AI infrastructure.
- Revenue (2020): $102B (33% CAGR).
11. Electric Vehicles (EVs)
- Key Players: Tesla, BYD, legacy automakers
- Growth Drivers: Battery tech, sustainability policies.
- Revenue (2020): $101B (nascent in 2005).
12. Information-Enabled Business Services
- Key Players: ADP, Experian, Deloitte
- Growth Drivers: Data analytics, outsourcing.
- Revenue (2020): $150B (5% CAGR).
Key Trends from the 12 Super High-growth Sectors
✔ Digitization Dominates – 8 of 12 arenas are tech-driven (software, cloud, e-commerce, etc.).
✔ Winner-Takes-Most Dynamics – Top players captured ~70% of market cap in concentrated industries.
✔ New Entrants Thrive – 34% of 2020 market cap came from companies that didn’t exist in 2005.
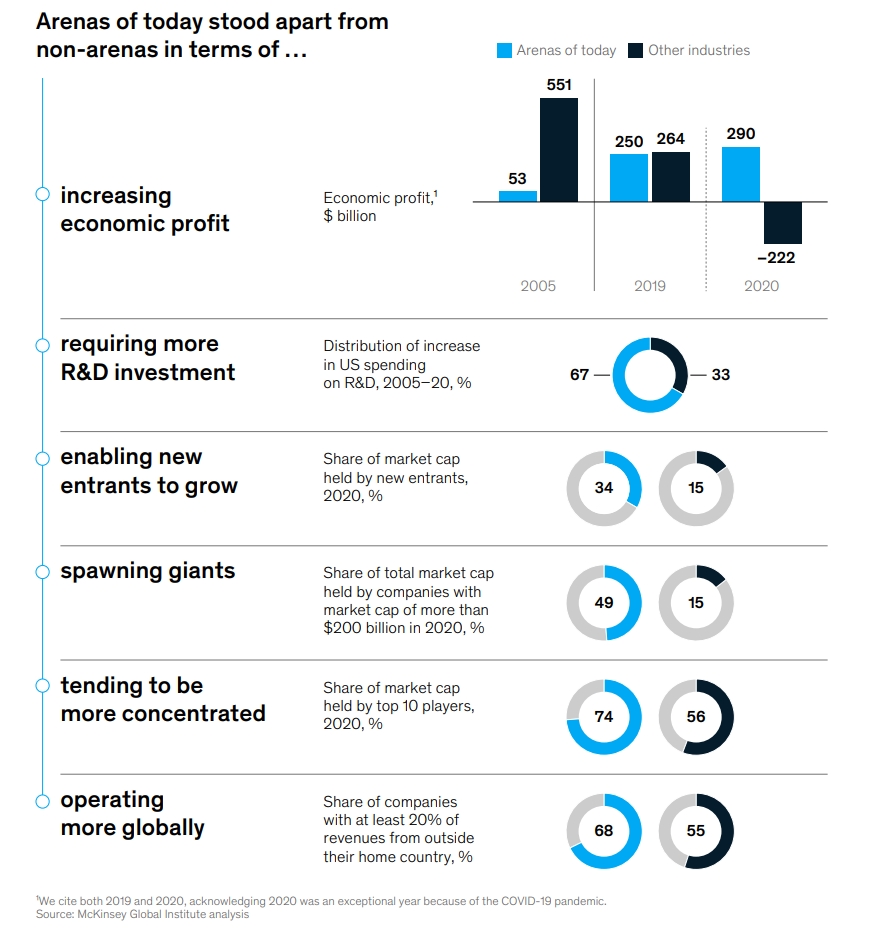
Today’s arenas stand out from other industries in six ways:
- Arenas captured an increasing share of economic profit. In 2005, arenas generated $53 billion, or 9 percent of total global economic profit, while other industries generated $551 billion, 91 percent of the total. By 2019, arenas were generating $250 billion—half of total global economic profit.
- Arenas attracted outsize levels of investment for innovation. Arenas’ share of R&D investment was already high in 2005 and remained high for 15 years. Sixty-two percent of US business R&D spend went to arenas and arena-adjacent industries in 2005; that figure increased to 65 percent by 2020.
- Arenas enabled new entrants to grow. In 2020, 34 percent of arenas’ total market capitalization was held by companies that had been “outsiders” in 2005—that did not exist, had market caps of less than $3.5 billion, or existed but were not yet meaningful competitors in those arenas. In comparison, businesses new to non-arena industries held just 15 percent of total market cap.
- Arenas spawned giants. Arenas were more likely than non-arenas to give rise to the world’s largest companies. In 2020, 74 percent of arenas’ total market cap was held by companies with market caps greater than $50 billion, compared with 47 percent for other industries. Large companies were also more likely to be in arenas. Of the companies with market caps above $200 billion, half belonged to arenas, even though arenas represent only one-fifth of the overall sample by number of companies. In 2005, just one of the top ten companies was in a future arena—Microsoft, with a market cap of $278 billion. By 2020, eight of the ten were in arenas, with market caps ranging from $631 billion to $2.3 trillion.
- Arenas tended to be more concentrated. Concentration was observed at certain times in arenas; for example, the top ten players in four arenas (cloud services, consumer electronics, EVs, and payments) accounted for at least 90 percent of 2020 arena market cap and revenues in our sample. At the same time, competitive pressure to innovate remained. Investments that improve products or take advantage of network effects can have increasing returns, requiring leaders to continually innovate to retain prominence. Arenas’ industry structures are rarely static or stable in the long term. Escalatory investments and their exceptional returns for arenas can inspire fierce competition in markets that already have high levels of innovation, provoking step changes in technology and business, which can disrupt the ranks of winners.
- Arenas were more global. On average, 50 percent of arena revenues were generated outside companies’ home regions, compared with 42 percent for non-arena companies. Companies in arenas were also much more likely to be multinationals. Sixty-eight percent of arena companies derived more than 20 percent of their revenues from countries other than their own. By contrast, about half of non-arena companies took in more than 20 percent of revenues from other countries.
The origins of arenas
We observed three elements that, when combined, were likely to result in high growth and high dynamism and to generate an arena. The three ingredients, which we call an “arena-creation potion,” are business model or technology step changes, escalation incentives for investments, and a large or growing addressable market.
- Business model or technology step changes. Technology performance and adoption are often modeled as idealized S-curves. When a technology capability undergoes a step change, adoption starts off slowly, reaches an inflection point when it accelerates, then flattens out as the technology reaches maturity. Business model step changes can also result from technology that shifts commercial models (who pays for what and how) for products or services, thereby disrupting existing market structures, as occurred with e-commerce and with video and audio entertainment (streaming).
- Escalatory incentives for investments. Companies that leverage investments to not only produce more products but fundamentally change and improve their products can boost their competitive position and rapidly gain market share. Such investments are features of specific types of spending, such as marketing, R&D, and certain capital expenditures. As companies advance their capabilities in this way, they tend to also improve long-term margins and see returns increase with scale. As a result, competitors also have a strong incentive to invest, beginning an “arms race” in which they iteratively invest to scale and scale to invest, causing a simultaneous escalation in capabilities. This pattern accelerates growth and the kind of market share jumps that are typical of arenas, and eventually can limit the ability for new entrants to enter the arena, unless a new technology or business model step change again opens up the playing field.
- Large or growing addressable market. Companies tend to reach large or fast-growing markets either by already playing in sizable markets where demand growth continues to outstrip the rest of the economy or by displacing share of an existing large market with a superior product or service. These markets typically already had revenue pools of more than $100 billion in 2005, and companies competing in them made escalatory investments that improved efficiencies or broadened capabilities.
Competition in these settings can be like a tournament with a huge prize to the winner, but it is not a lifelong crown, because a new round of competitive escalation often begins just as the last one is settling.
This dynamic contrasts with more traditional modes of competition, which involve initial entry costs and additional investments to increase production quantity that result in more localized and static industry structures. In escalatory competition, players must iteratively improve product quality through investment and capability building to obtain or retain market share.
In addition, the arenas of today generally benefited from the overall trend toward digitization. This last era of digitization was a fertile place for big arenas to bloom. Global internet connectivity allowed e-commerce players to connect buyers and sellers across the globe, providing the opportunity for customers to purchase goods anytime, anywhere.
Continual exponential improvements in the cost of processing and communicating information created a long S-curve. Digitization enabled global markets and scaled distribution platforms.
The 18 Future Arenas of Competition
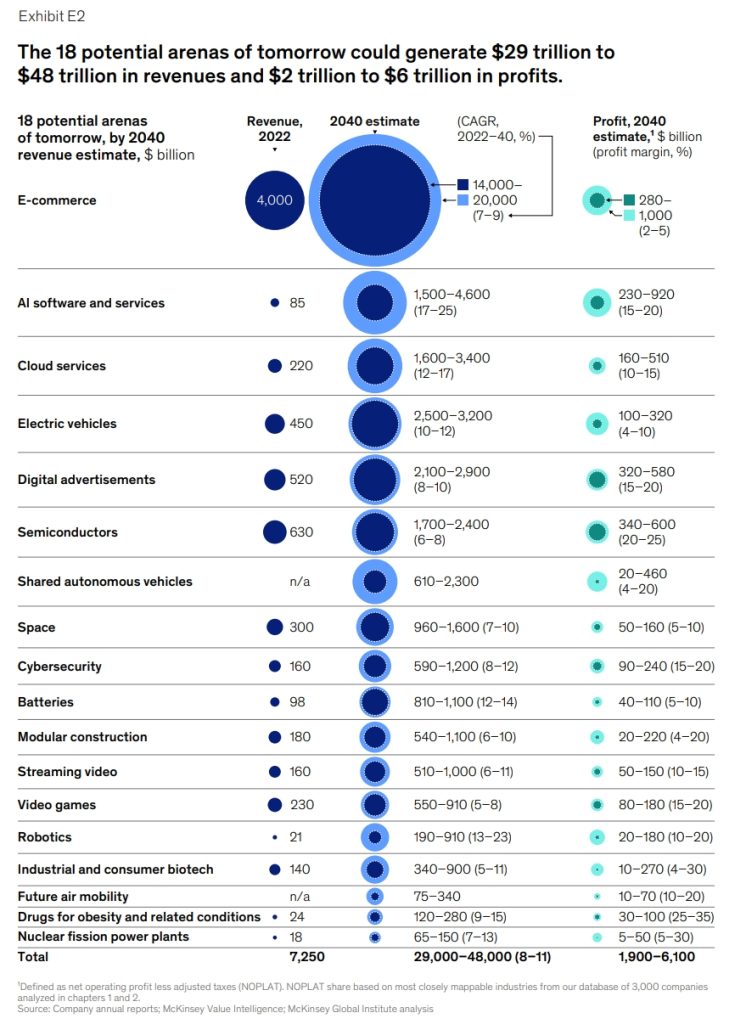
We have identified 18 potential future arenas that together could yield $29 trillion to $48 trillion in revenues and $2 trillion to $6 trillion in profits by 2040 (Exhibit E2). In terms of impact on the economy, we estimate that they could grow from about 4 percent of GDP in 2022 to 10 to 16 percent by 2040. This translates to a 18 to 34 percent share of total GDP growth just from super high-growth sectors of future.
The potential future high-growth arenas can be divided into three groups: arenas of today that are likely to continue developing into arenas of tomorrow; subsegments of current arenas that may grow sufficiently large and fast to become spin-off arenas; and emergent arenas that are not as closely linked as the potential spin-offs to any of today’s arenas.
Here’s a breakdown of the industries expected to dominate the next two decades, categorized into continuing, spin-off, and emergent arenas:
🚀 Continuing Arenas (Existing Industries Accelerating Further)
These four current arenas will keep growing at an even faster pace:
- E-commerce ($14–20T by 2040)
- Growth: Social commerce, grocery expansion, emerging markets.
- Key Players: Amazon, Alibaba, Shopify.
- Electric Vehicles (EVs) ($2.5–3.2T)
- Growth: Battery breakthroughs, charging networks, policy support.
- Key Players: Tesla, BYD, legacy automakers.
- Cloud Services ($1.6–3.4T)
- Growth: AI infrastructure, hybrid cloud, data sovereignty.
- Key Players: AWS, Microsoft Azure, Google Cloud.
- Semiconductors ($1.7–2.4T)
- Growth: AI chips, IoT, automotive demand.
- Key Players: Nvidia, TSMC, Intel.
🌀 Spin-Off Arenas (New Segments Emerging from Current Arenas)
These three industries are branching off from existing high-growth sectors:
- AI Software & Services ($1.5–4.6T)
- Growth: Generative AI, enterprise automation, hyper-personalization.
- Key Players: OpenAI, Google DeepMind, Anthropic.
- Digital Advertising ($2.1–2.9T)
- Growth: Programmatic ads, short-form video, AI-driven targeting.
- Key Players: Meta, Google, TikTok.
- Streaming Video ($510B–1T)
- Growth: Ad-supported tiers, global internet expansion.
- Key Players: Netflix, Disney+, YouTube.
⚡ Emergent Arenas (Brand-New High-Growth Industries)
These 11 industries are nascent but set for explosive growth:
- Shared Autonomous Vehicles (SAVs) ($610B–2.3T)
- Growth: Self-driving tech, robotaxis, regulatory shifts.
- Key Players: Waymo, Cruise, Tesla.
- Space Economy ($960B–1.6T)
- Growth: Satellite internet, reusable rockets, lunar exploration.
- Key Players: SpaceX, Blue Origin, Starlink.
- Cybersecurity ($590B–1.2T)
- Growth: AI-powered threats, zero-trust architecture.
- Key Players: Palo Alto Networks, CrowdStrike.
- Batteries ($810B–1.1T)
- Growth: Solid-state tech, grid storage, EV demand.
- Key Players: CATL, Panasonic, Tesla.
- Video Games ($550B–910B)
- Growth: Cloud gaming, metaverse integration, esports.
- Key Players: Tencent, Sony, Microsoft (Activision).
- Robotics ($190B–910B)
- Growth: AI-powered automation, humanoid robots.
- Key Players: Boston Dynamics, Tesla Optimus.
- Industrial & Consumer Biotech ($340B–900B)
- Growth: Lab-grown meat, CRISPR, sustainable materials.
- Key Players: Impossible Foods, Ginkgo Bioworks.
- Modular Construction ($540B–1.1T)
- Growth: Prefab housing, 3D printing, labor shortages.
- Key Players: Katerra (defunct but indicative of sector trends).
- Future Air Mobility ($75B–340B)
- Growth: eVTOLs (flying taxis), drone deliveries.
- Key Players: Joby Aviation, Archer Aviation.
- Obesity Drugs ($120B–280B)
- Growth: GLP-1 therapies (e.g., Ozempic, Wegovy).
- Key Players: Novo Nordisk, Eli Lilly.
- Nuclear Fission Power ($65B–150B)
- Growth: Small modular reactors (SMRs), decarbonization.
- Key Players: NuScale, TerraPower.
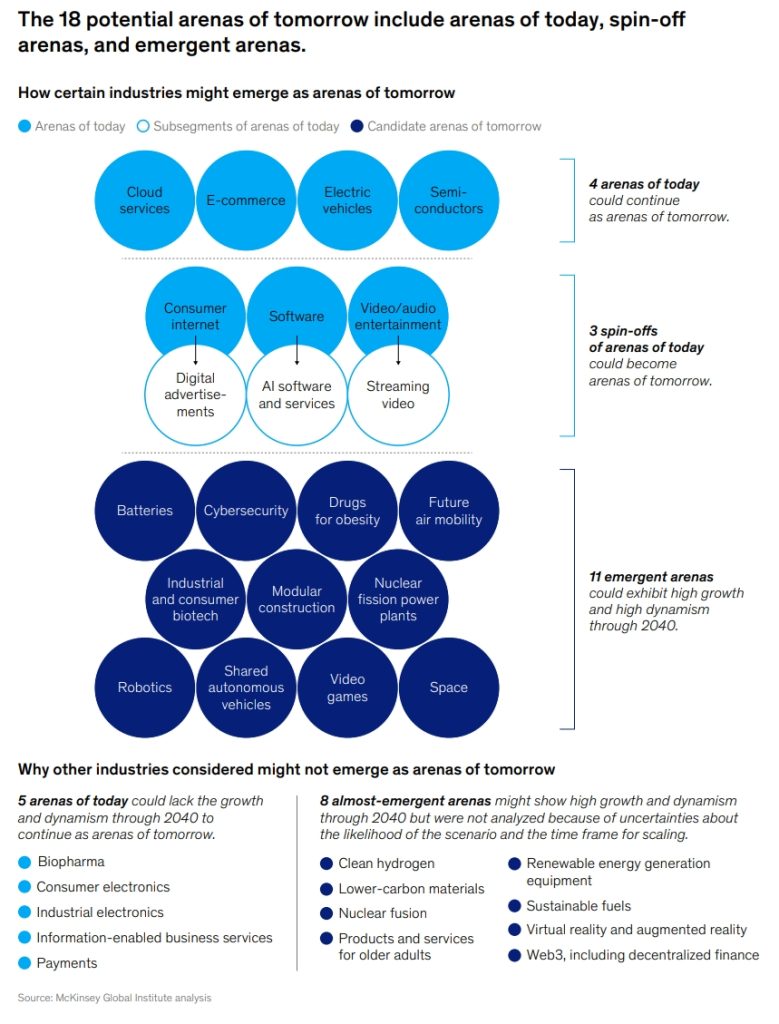
Five arenas of today—biopharmaceuticals, consumer electronics, information-enabled business services, industrial electronics, and payments—could lose arena status. They are unlikely to maintain the scale of growth and dynamism that would propel them into being super high-growth sectors of future.
We also examine almost-emergent arenas, industries with some elements that could make them arenas but that also have uncertain growth or dynamism prospects and a relatively lower probability of evolving into arenas. We include these because predicting the development of arenas is not an exact science, and we recognize that we could be wrong. These potential arenas could represent significant opportunities to be as super high-growth sectors of future.
The almost-emergent arenas include clean hydrogen, lower-carbon materials, products and services for older adults, nuclear fusion, renewables generation equipment and infrastructure, sustainable fuels, virtual reality and augmented reality, and Web3 (including decentralized finance).
Key Insights for Businesses & Investors
✅ Digitization Still Rules – AI, cloud, and e-commerce remain dominant.
✅ Sustainability = Profit – EVs, batteries, and clean energy are trillion-dollar bets.
✅ Healthcare Breakthroughs – Obesity drugs and biotech will redefine medicine.
✅ Physical-Digital Convergence – Robotics, SAVs, and space merge hardware with AI.
Swing Factors That Could Reshape These Arenas
- Geopolitics (e.g., semiconductor supply chains).
- AI Adoption Speed (enterprise vs. consumer use).
- Green Transition Pace (policy, tech, and consumer buy-in).
Future of Business and Living
The 18 arenas of tomorrow or super high-growth sectors of future could be even more materially transformative than the 12 arenas of today, shaping how we consume and process data, approach health and wellness, and interact and communicate with one another. They could introduce new options for our lives as well as new questions about our social progress, from the morality and ethics underpinning data and privacy to imperatives for businesses to be inclusive and sustainable. Recognizing how and when arenas originate, understanding how they evolve, and anticipating the way they could change society can offer a unique view of the arc of society’s progress.
The next two decades will see unprecedented shifts in global industries. Companies that align with these 18 arenas—whether through innovation, investment, or adaptation—will lead the future economy.
Which arena will your business compete in?
Contact us to discover more and learn how to stay ahead in future arenas of competition and being part of super high-growth sectors of future.
See McKinsey to read and download full report or check out NeoForm LinkedIn page.
1 Comment
EY Global IPO Trends Q2 2025: Navigating Volatility, Seizing Opportunity | NeoForm - NeoForm Business Partners
[…] The Next Big Arenas of Competition: 18 Super High Growth Sectors Shaping the Future Econo… […]
Comments are closed.