

“FP&A Storytelling in a Data-Driven World,” provides a comprehensive guide for Financial Planning & Analysis (FP&A) professionals to enhance their storytelling capabilities, leveraging data visualization and technology to communicate complex financial data effectively, drive better decision-making and create a lasting impact on stakeholders.
You can download the full report from FP&A Trends website or NeoForm LinkedIn page.
Below is a detailed summary of the document, highlighting its key points about storytelling in FP&A:
Introduction
- The FP&A storyteller has emerged as one of the five critical roles within the FP&A function, especially in a data-driven world where the volume of data is exponentially increasing, and the time to process insights is decreasing.
- The FP&A storyteller’s role extends beyond traditional finance, working across the business to present insights in a way that drives action and leaves a lasting impression on stakeholders.
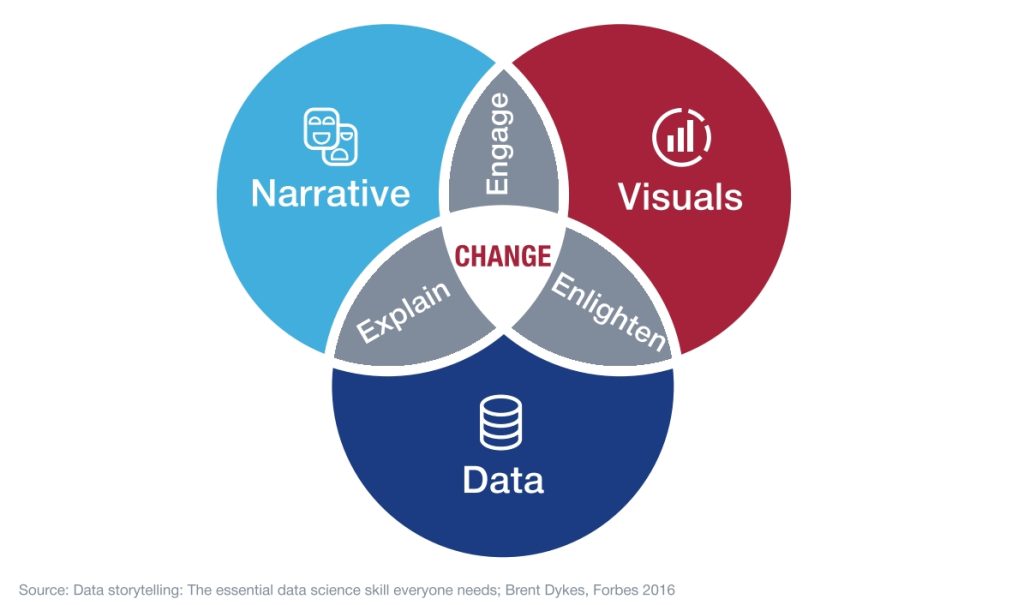
- Three foundational elements for effective FP&A storytelling are building a narrative, visualizing data, and leveraging technology.
1. Building a Narrative
- Key Point: The FP&A storyteller must guide the audience through the data to reach the same conclusions.
- Steps to Build a Narrative:
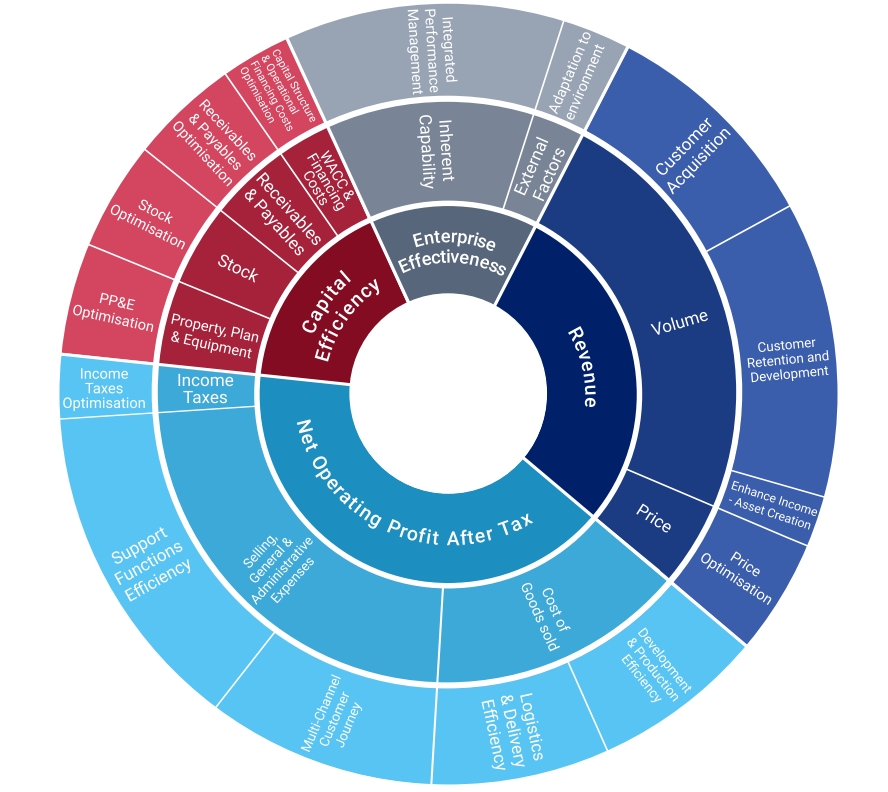
- Understand Value Drivers: Use frameworks like Alfred Rappaport’s seven drivers of value to identify what drives organizational value (e.g., revenue growth, customer acquisition, pricing strategies).
- Create a Decisions Calendar: Document the decisions made, who makes them, and the data needed to support them. This helps in planning stakeholder meetings and preparing scenarios in advance.
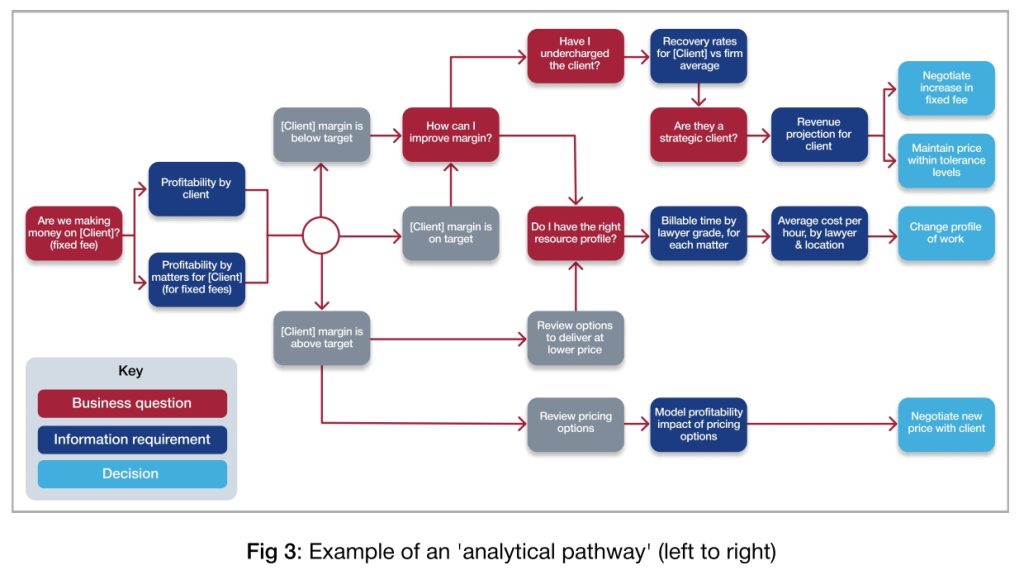
- Map Analytical Pathways: Sequence data in a way that tells a story, guiding stakeholders through the decision-making process. For example, if market share falls, the pathway might suggest increasing marketing spend.
- Static Charts are the Enemy: Static charts limit the ability to explore data dynamically. Modern analytical tools allow for real-time data exploration, enabling more agile decision-making.
2. Visualizing Data
- Key Point: Data visualization is crucial for communicating insights effectively and creating impact.
- Why Visualize Data?
- Visualizations help stakeholders see trends and patterns that might be missed in tabular data.
- They engage non-finance stakeholders and make data more accessible.
- Types of Visualizations:
- Line charts for trends over time.
- Bar charts for comparisons.
- Scatter plots for distributions.
- Stacked bar charts or treemaps for compositions (avoid pie charts).
- Bubble plots for relationships.
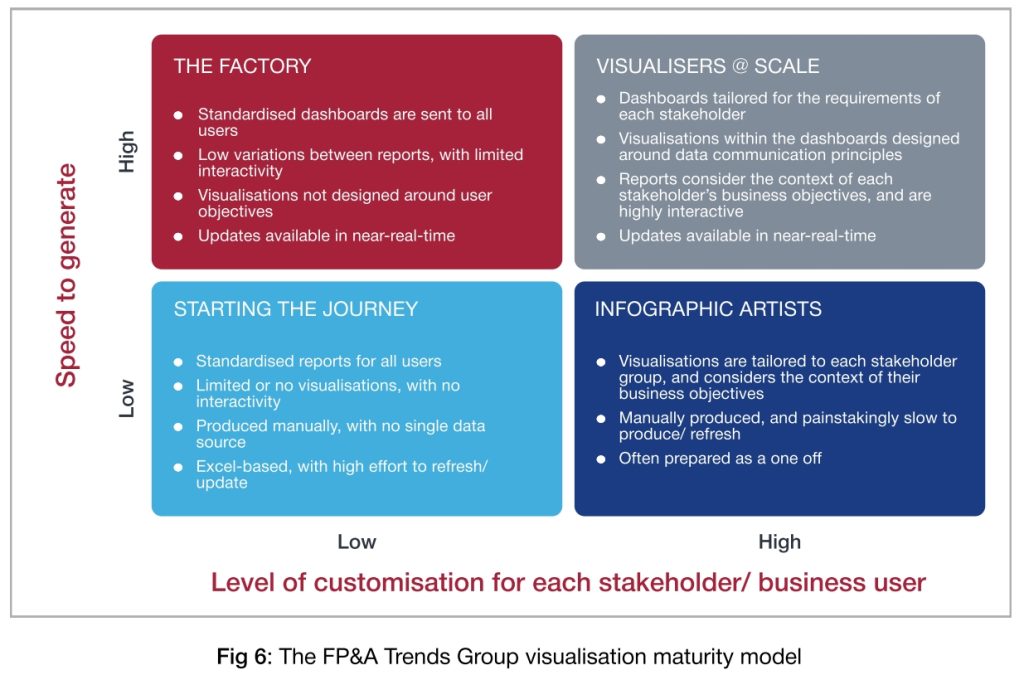
- Data Visualization Maturity Curve:
- Organizations progress from basic reporting (Starting the Journey) to tailored visualizations (Infographic Artists) and eventually to scalable, real-time visualizations (Visualisers @ Scale).
- Best-in-class organizations provide customized visualizations to thousands of users in near-real-time, guiding decision-making effectively.
3. Digital Analytical Transformation Through Technology
- Key Point: Technology is essential for effective storytelling, enabling faster data access, deeper analysis, and more agile decision-making.
- Corporate Performance Management (CPM) Applications:
- CPM tools have evolved significantly, with cloud-based solutions reducing implementation time from months to weeks.
- Cloud technology allows for greater collaboration, real-time data access, and scalability.
- Challenges in Technology Adoption:
- Only 35% of organizations provide live access to key business information due to poor data quality and lack of data culture.
- Best-in-class organizations have a data strategy and data quality management framework in place, ensuring data is captured, stored, and presented effectively.
- Agile Implementation:
- Organizations should focus on high-impact areas first (e.g., revenue models) and use an agile approach to deliver data products incrementally.
- Enhancing Data Skills:
- FP&A teams need to develop data skills (e.g., SQL, Python) to move beyond Excel and leverage modern tools.
- Change management is critical to ensure adoption of new technologies. Employees need to feel that the new systems simplify their work and address their pain points.
4. The Future of FP&A Storytelling
- Key Point: The future of FP&A storytelling lies in the integration of Artificial Intelligence (AI) and Machine Learning (ML).
- Augmented Intelligence: AI and ML will identify trends, uncover hidden insights, and provide recommendations, allowing FP&A professionals to focus on interpreting and acting on the data.
- Automation: Fully automated planning and reporting will free up time for FP&A teams to focus on strategic insights and storytelling.
Conclusions
- The combination of storytelling and technology has a transformative impact on organizational performance.
- Key Recommendations:
- Focus narratives on organizational value drivers.
- Use data visualization to communicate insights effectively.
- Implement available technology to provide instant insights and build a robust data quality framework.
- Develop data skills across the organization and ensure employees are engaged in the transformation journey.
Thanks to FP&A Trends and Authors for putting together and sharing this insightful guide:
Tanbir Jasimuddin
Larysa Melnychuk