


Introduction
In the fast-paced world of Software-as-a-Service (SaaS), data-driven decision-making is the key to success. Whether you’re a startup founder, a CFO, or a growth-focused executive, understanding the right financial metrics can make or break your business.
SaaS Metrics 101 by Mosaic dives deep into the essential financial SaaS metrics that investors, stakeholders, and leadership teams rely on to measure performance, efficiency, and scalability. From Annual Recurring Revenue (ARR) to Customer Acquisition Cost (CAC) and Burn Multiple, we’ll break down each metric, explain why it matters, and provide actionable benchmarks to help you optimize your strategy.
Why Financial SaaS Metrics Matter
SaaS businesses operate on a subscription-based model, which means revenue predictability, customer retention, and efficient growth are critical. Unlike traditional businesses, SaaS companies must track recurring revenue, churn, and customer lifetime value to ensure long-term sustainability.
Investors scrutinize these metrics to assess a company’s health, while internal teams use them to refine pricing, sales efficiency, and operational spending. In today’s competitive landscape, growth at all costs is no longer viable—efficiency and profitability take center stage.
The Most Important SaaS Metrics
1. Annual Recurring Revenue (ARR)

What it is: The total predictable revenue generated from subscriptions on an annual basis.
Why it matters: ARR is the lifeblood of SaaS companies, indicating revenue stability and growth potential.
Key Insights:
- Median growth rate (2021): 42%
- Healthy growth benchmark: 4x or higher
- Critical questions to ask:
- How quickly are you acquiring new ARR?
- Which products generate the most revenue?
- What’s your expansion and churn rate?
Pro Tip: Slice ARR by customer segments, product lines, and cohorts to uncover hidden growth opportunities.
2. Revenue Run Rate
What it is: A projection of annual revenue based on current performance.
Why it matters: Helps forecast future revenue and identify trends early.
Formula:

Benchmarks:
- Ideal ratio: 2:1 (ARR growth vs. headcount comp growth)
- Expected median growth (2022): 36%
Use Case: Investors use this to gauge whether revenue trends align with growth expectations.
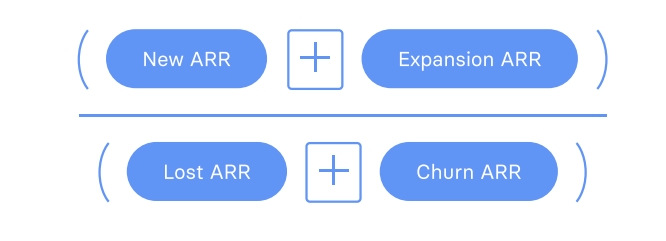
3. SaaS Quick Ratio
What it is: Measures efficiency by comparing new ARR growth to churn and contraction.
Why it matters: Identifies if revenue growth outpaces losses (a “leaky bucket” analysis).
Formula:
Benchmarks:
- <1: Churn is outpacing growth (danger zone)
- 1-4: Decent growth, but needs optimization
- 4+: Healthy, sustainable growth
Pro Tip: Investigate why the ratio is low—are sales cycles slowing, or is churn increasing?
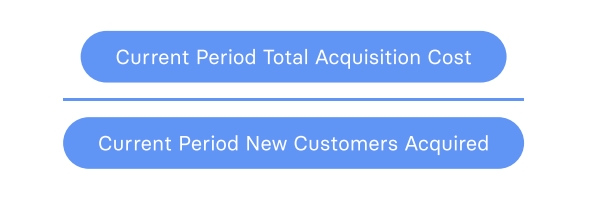
4. Customer Acquisition Cost (CAC)
What it is: The average cost to acquire a new customer.
Why it matters: Determines the efficiency of sales and marketing spend.
Formula:
Key Considerations:
- Fully burden CAC: Include all costs (salaries, ads, travel, etc.).
- Align with sales cycle: If sales take 60 days, measure CAC over that period.
Benchmarks:
- Median CAC for 5M−5M−20M ARR companies: 31% of revenue
- High-growth companies (80%+ growth): Spend 59% on sales & marketing
Pro Tip: A rising CAC may indicate market saturation or inefficient campaigns.
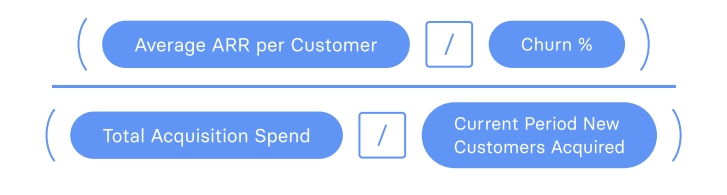
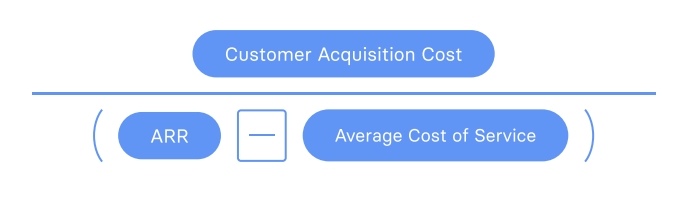
5. LTV:CAC Ratio
What it is: Compares customer lifetime value to acquisition cost.
Why it matters: Shows ROI on sales and marketing investments.
Formula:
Benchmarks:
- <2.5x: Poor efficiency (re-evaluate spend or retention)
- 3x: Historically the “golden rule”
- 4x+: Top-tier performance
Pro Tip: Improve LTV by reducing churn or increasing upsells.
6. Burn Multiple
What it is: Measures cash efficiency by comparing net burn to new ARR.
Why it matters: Indicates how much cash is burned to generate $1 of new revenue.
Formula:

Benchmarks:
- <1x: Highly efficient
- 1-2x: Moderate efficiency
- >2x: Overspending (danger zone)
Pro Tip: Cut discretionary spend if your burn multiple is too high.
7. Net Dollar Retention (NDR)
What it is: Measures revenue retention, including expansions and churn.
Why it matters: Shows if customers are growing with you over time.
Formula:

Benchmarks:
- <100%: Revenue is shrinking (high churn)
- 100-120%: Stable
- 120%+: Best-in-class (e.g., top SaaS companies)
Pro Tip: Slice NDR by customer segments to identify weak points.
Advanced Financial SaaS Metrics
Rule of 40
Balances growth and profitability:
Formula:

- >40: Excellent performance
- <40: Needs optimization
CAC Payback Period
Time to recover CAC:
- Ideal: 12 months or less
- Enterprise SaaS: 9-24 months (depending on ACV)
ARR Per Employee
Measures operational efficiency:
- Early-stage target: 150K−150K−200K
- Scaled companies: 250K−250K−300K
Conclusion: Mastering Financial SaaS Metrics for Growth
Tracking the right financial SaaS metrics is non-negotiable for sustainable growth. From ARR and CAC to LTV:CAC and Burn Multiple, each metric provides unique insights into your business’s health.
Key Takeaways:
✅ Focus on recurring revenue efficiency (ARR, NDR).
✅ Optimize customer acquisition (CAC, LTV:CAC).
✅ Monitor cash burn and runway (Burn Multiple, Rule of 40).
✅ Slice data by cohorts, segments, and products for deeper insights.
For more details, check out Mosaic full report here or NeoForm LinkedIn page.
For more strategic finance insights, please contact us.